The complexity of the Middle East is often used as an excuse to avoid even thinking about it. Or teaching about it. And especially to avoid doing anything about it. And now there are significant risks for any Palestinian support.
As I try to make sense of all this, I’m very glad to be able to use some of the new artificial intelligence (AI) research tools.
I’ve been focused on Google’s NotebookLM, an application that is fundamentally different from other AI applications because it will only work on sources you load into it.
And yesterday I began to learn to use Google’s new Gemini 2.5 Flash application. That does deep research and creates documents, including a link for each reference used. The underlying difference between the two is that NotebookLM strictly confines its AI work to the sources you load into your project. Whereas Gemini 2.5 Flash does extensive research on the Internet for its sources of data.
This PDF is about significant factors related to the colonization and decolonization of Palestine, which I created with Gemini 2.5 Flash. It correctly cites and uses many references.
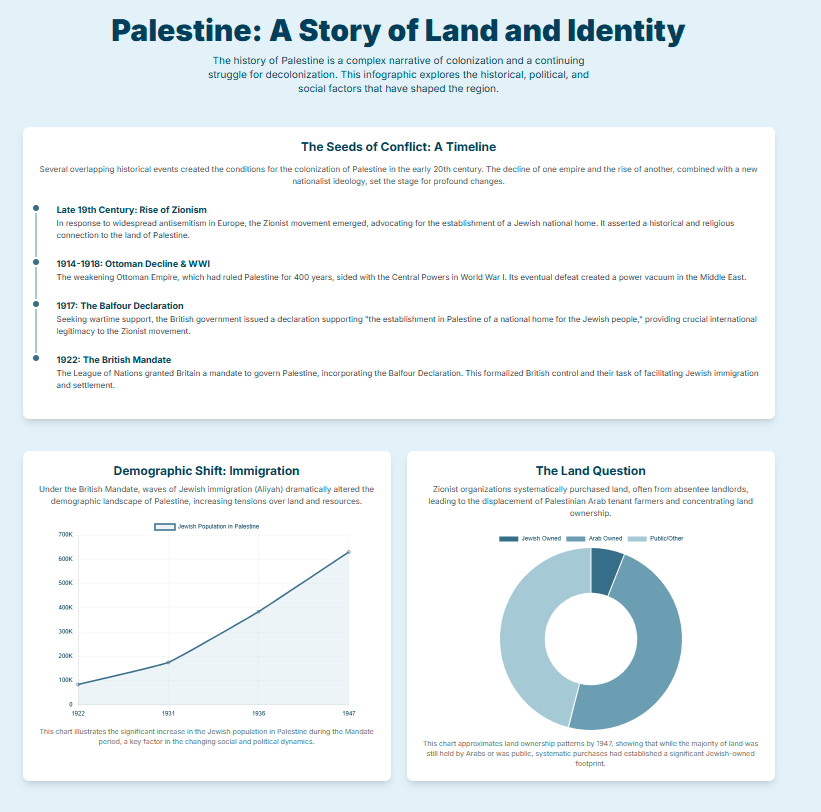
Significant Factors Related to Colonization of Palestine
Infographic
A really exciting feature of Gemini 2.5 Flash is being able to create infographics from your sources. Infographics can provide excellent ways to visualize your data. This is the first infographic I created with the app. Click on this link to see the complete Infographic. https://gemini.google.com/share/00d0d23a8097
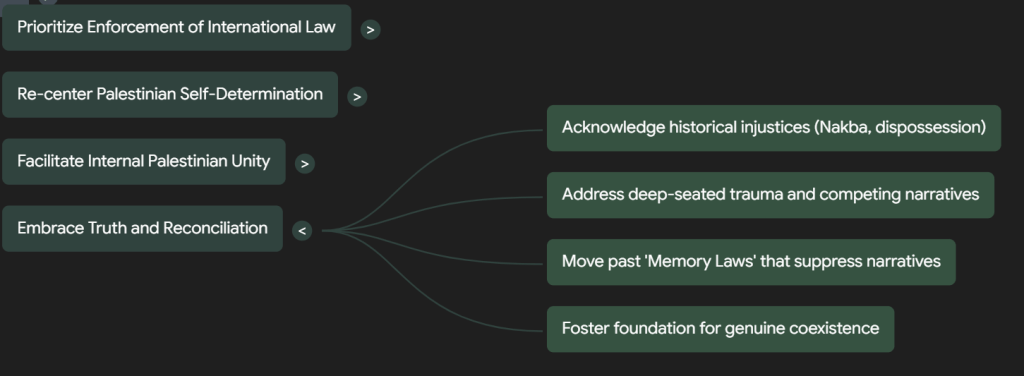
The following two images are from the Mind Map that was created from the sources in the NotebookLM project about colonization and Palestine.
Palestine Colonization and Decolonization
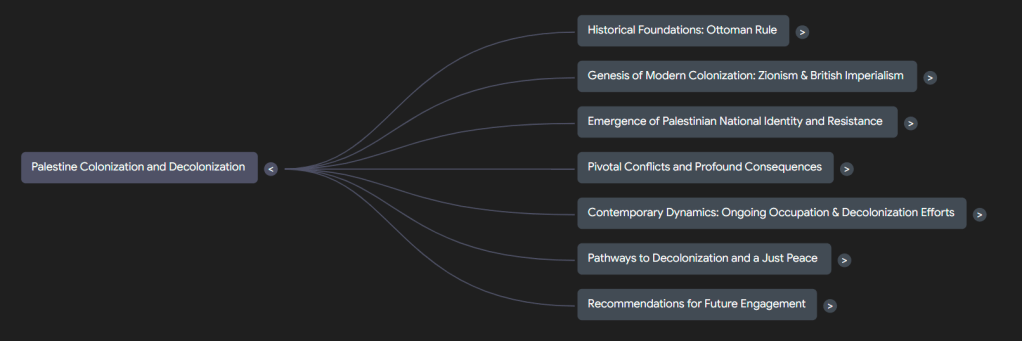
Recommendations for future engagement