https://unflinching.blog/2024/08/20/build-your-own-climate-story-with-real-numbers/

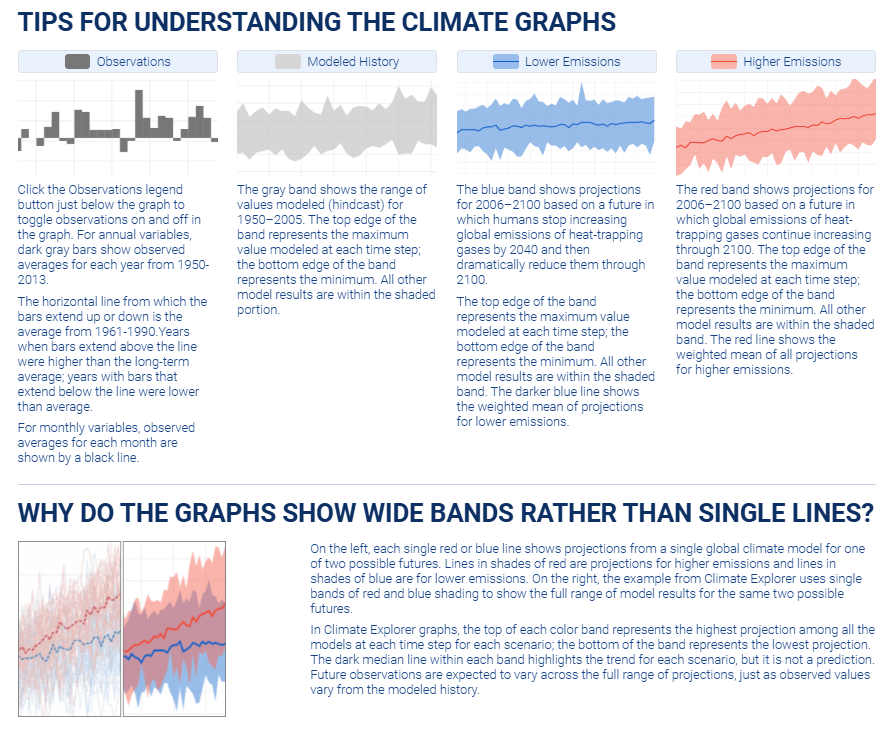
At the end of this are Tips for Understanding Climate Graphs.
I’ve been writing about the Climate Explorer because it gives us a way to understand things visually. That’s helpful for our own understanding, and to be able to talk about climate change with other people. One thing I want to learn more about is the significance of some of the projections. What are the implications of an increase of 2 inches of total precipitation by the end of the century for example?
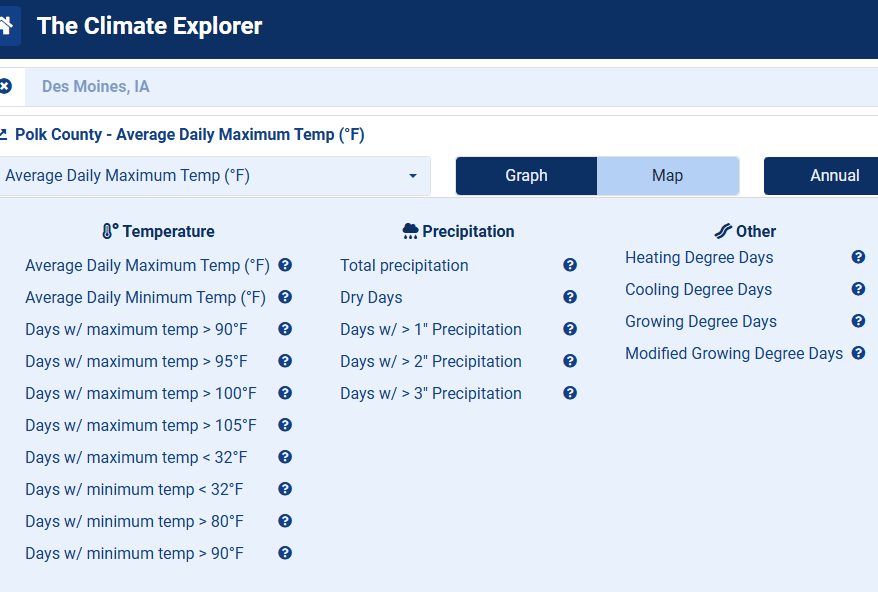
Polk County (Des Moines) Climate Stories:
Average Daily Max Temp
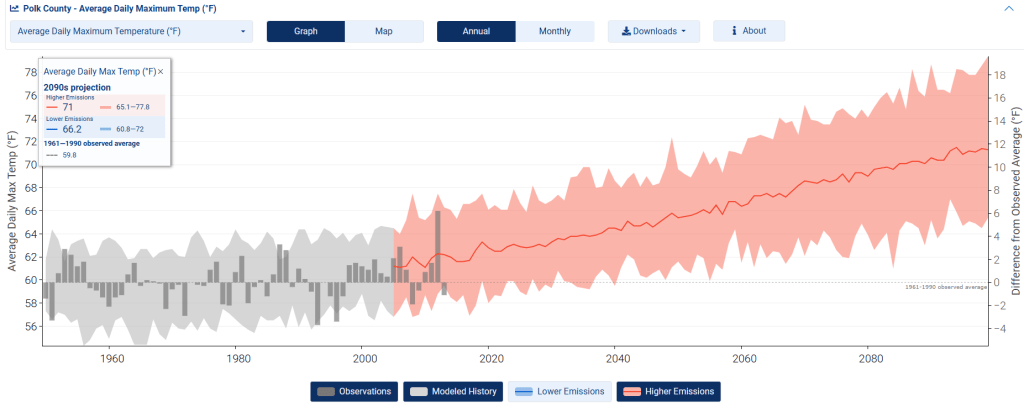
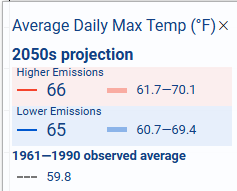
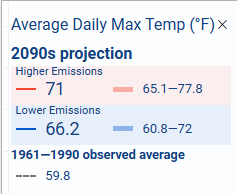
Late last century, Polk County had an average daily maximum temperature of 59.8 degrees. If emissions of heat-trapping gases continue increasing, the county is projected to see an average maximum temperature of 66 degrees in the middle of this century, and about 71 degrees at the end of the century.
Average Daily Minimum Temp
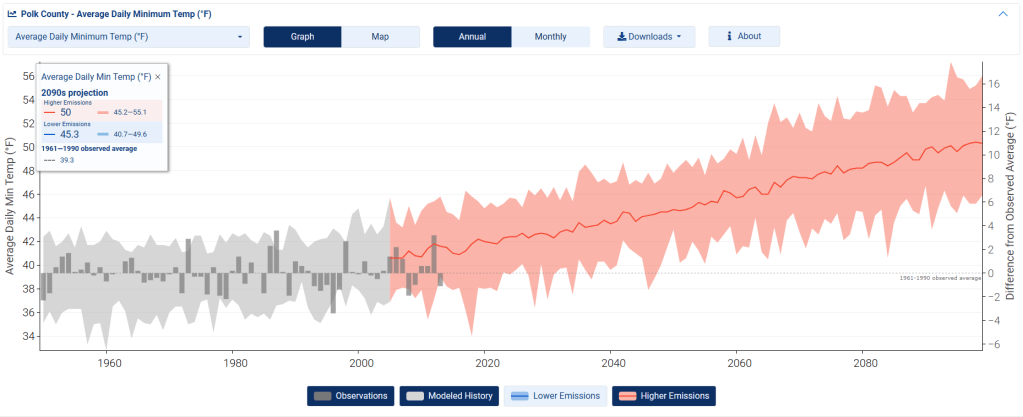
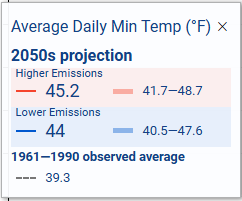
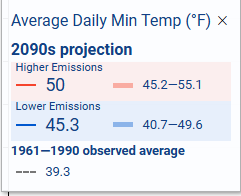
Late last century, Polk County had an average daily minimum temperature of 39.3 degrees. If emissions of heat-trapping gases continue increasing, the county is projected to see an average minimum temperature of 45.2 degrees in the middle of this century, and about 50 degrees at the end of the century.
Days with maximum temp > 90 degrees
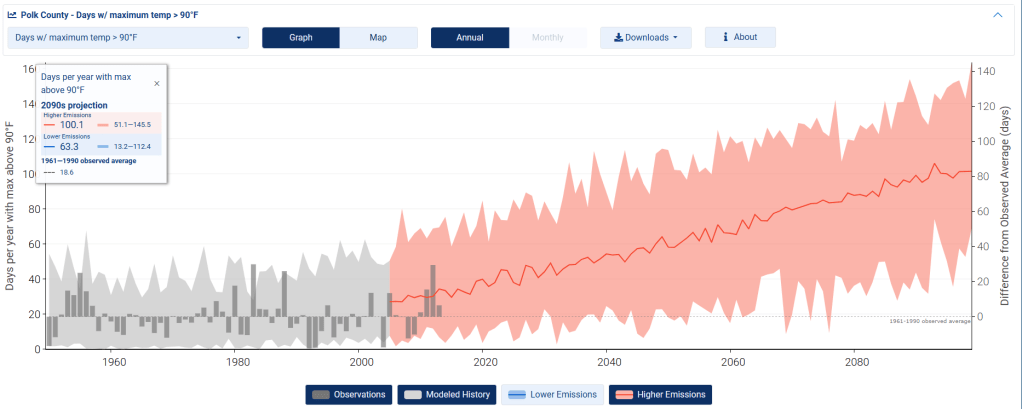
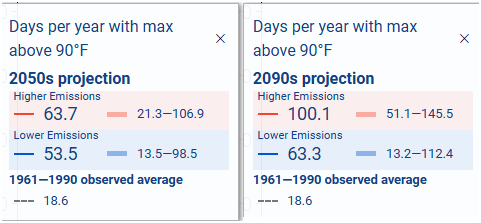
Late last century, Polk County had about 18.6 days per year when the temperature reached 90°F or higher. If emissions of heat-trapping gases continue increasing, the county is projected to see around 63.7 hot days per year in the middle of this century, and about 100.1 hot days per year at the end of the century.
Days with maximum temp > 100 degrees
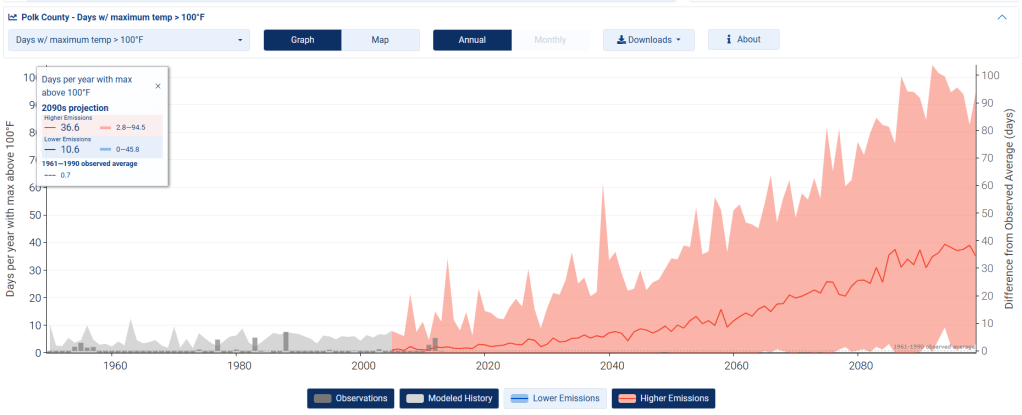
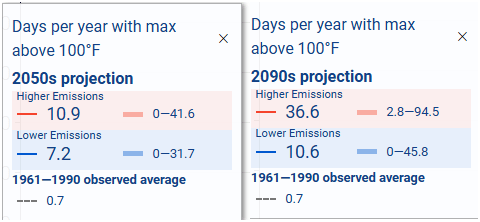
Late last century, Polk County had about 0.7 (that is, less than 1) days per year when the temperature reached 100°F or higher. If emissions of heat-trapping gases continue increasing, the county is projected to see around 10.9 very hot days per year in the middle of this century, and about 36.6 very hot days per year at the end of the century.
Total precipitation
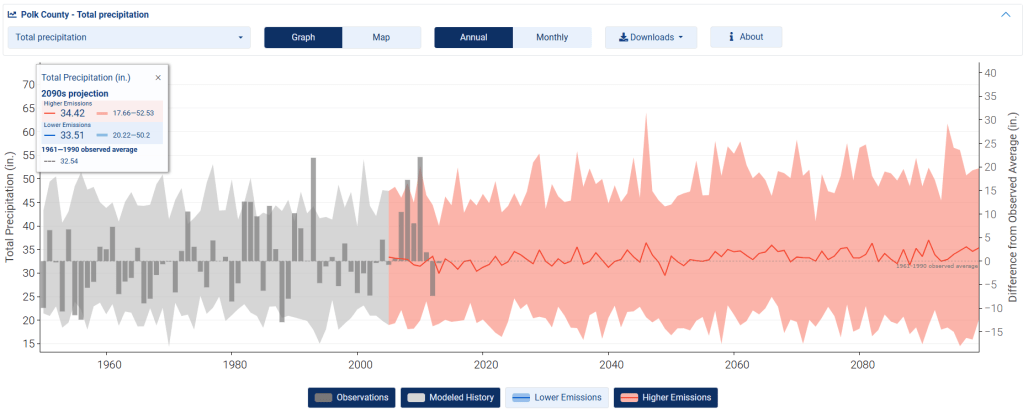
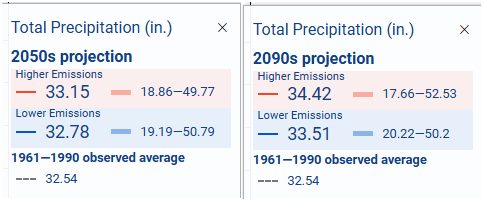
Late last century, Polk County had 32.54 inches total precipitation. If emissions of heat-trapping gases continue increasing, the county is projected to see around 33.15 inches of total precipitation in the middle of this century, and about 34.42 inches of total precipitation at the end of the century.