This first post about climate projections ended up being longer and a bit more complex than I intended. I’m sure I’ll be writing a lot more about this, so this is just an introduction.


Note: All temperatures are displayed as degrees Fahrenheit (F).
The Climate Explorer
That’s why I’ve begun research related to climate projections. The first thing I wanted to find were sources predicting the rate at which temperatures will continue to climb. I found National Oceanic and Atmospheric Administration’s (NOAA) Climate Explorer. https://crt-climate-explorer.nemac.org/
To use the tool, enter the location you are interested in the box. States must be entered as two letter abbreviations.
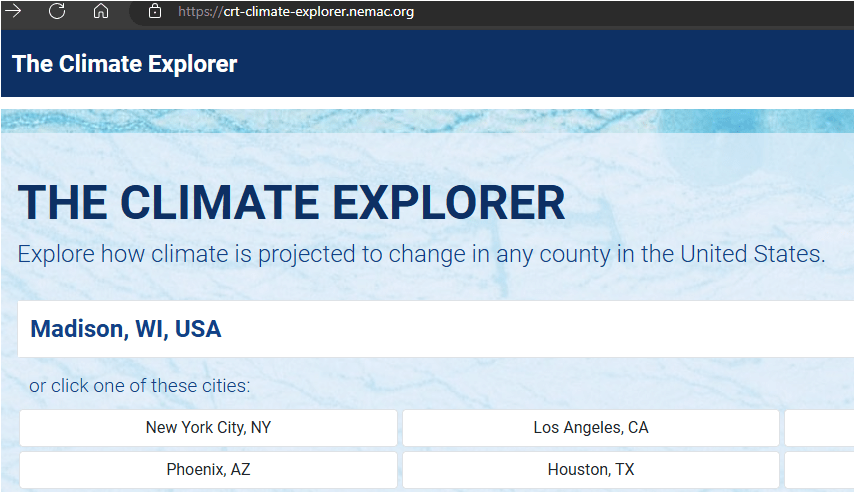
Once you have entered the city you are interested in, the following dashboard is displayed. (This data is for Madison, Wisconsin, Dane county.)
A very detailed explanation of these graphs can be found at the end of this.

Climate Graphs
Today I’m writing about Climate Graphs. Click on that part of the dashboard above (top, middle row). The following graphic will be displayed, showing Average Daily Maximum Temperatures projected through 2090.
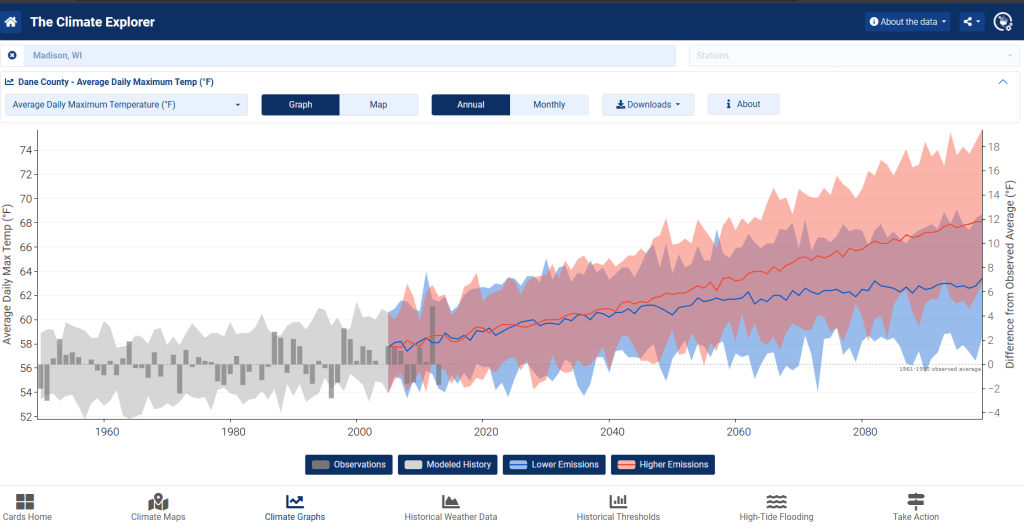
Average Daily Maximum Temperature (F)
In the top left corner of the graphic above you can see this is the Average Daily Maximum Temperature (F) for Dane County (Madison, WI).
The left Y axis is a measure of the average daily maximum temperature (F). The right Y axis is the scale for the Difference from Observed Average (F).
As you move the vertical cursor along the X axis (bottom), the data at that point in time is displayed.
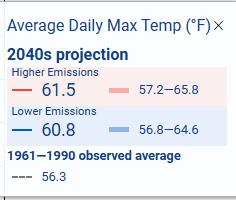
If you drag the cursor to the date of 2040 the following data will be displayed. If you click on the cursor, a snapshot of the data at that point will be displayed. The 2040 projections indicate the average daily maximum temperature will be 61.5 degrees under the higher emissions model, or 60.8 degrees if lower emissions are achieved.
The average daily maximum temperature for the data from 1961-1990 was 56.3 degrees (F)
Lower and Higher Emissions Scenarios
In 2040 the average daily maximum temperature is projected to be 61.5 degrees with Higher Emissions, or 60.8 degrees in a Lower Emissions scenario.
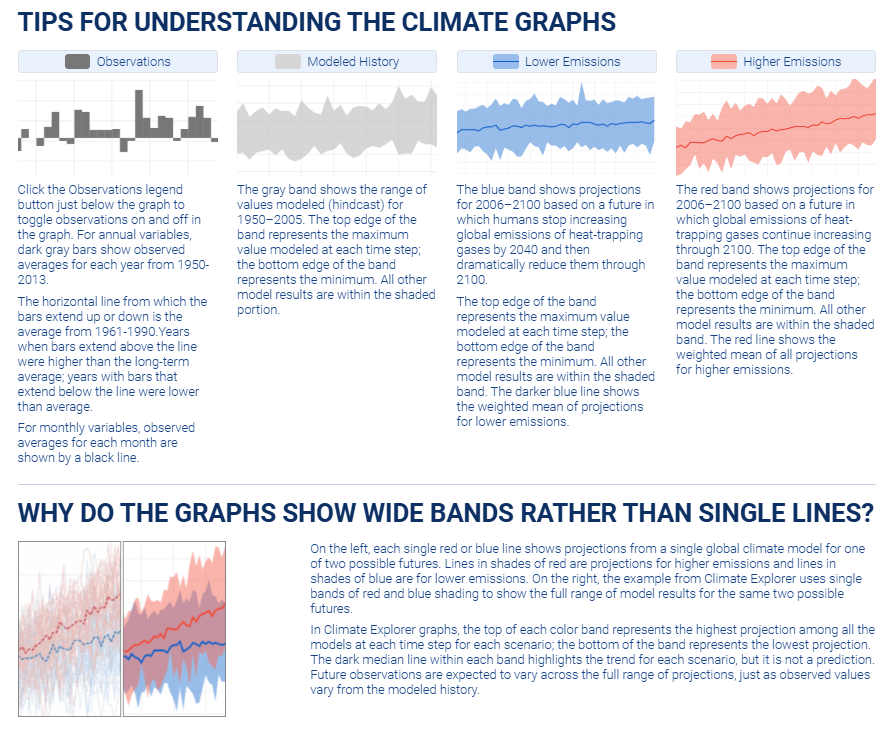
Lower (blue) and Higher (red) Emissions Scenarios are displayed.


The blue band shows projections for 2006-2100 based on a future in which humans stop increasing global emissions. A truly unlikely scenario. The red band show projections for 2006-2100 based on a future in which global emissions continue increasing.